THIS WORK IS PART OF QUESTION 4 : WHAT CAUSES THE VARIABILITY OF THE SSW ?
In summer 2018, an analysis of high-cadence white-light images taken by the Solar-Terrestrial RElations Observatory (STEREO) near solar maximum was published (DeForest et al., 2018). This detailed analysis revealed that outflowing density structures are released in a ubiquitous manner in the solar wind, as one can see here (video) or here (NASA article).
The present study investigated whether these density fluctuations could originate from the transient heating of the low corona observed during coronal bright points (CBPs).
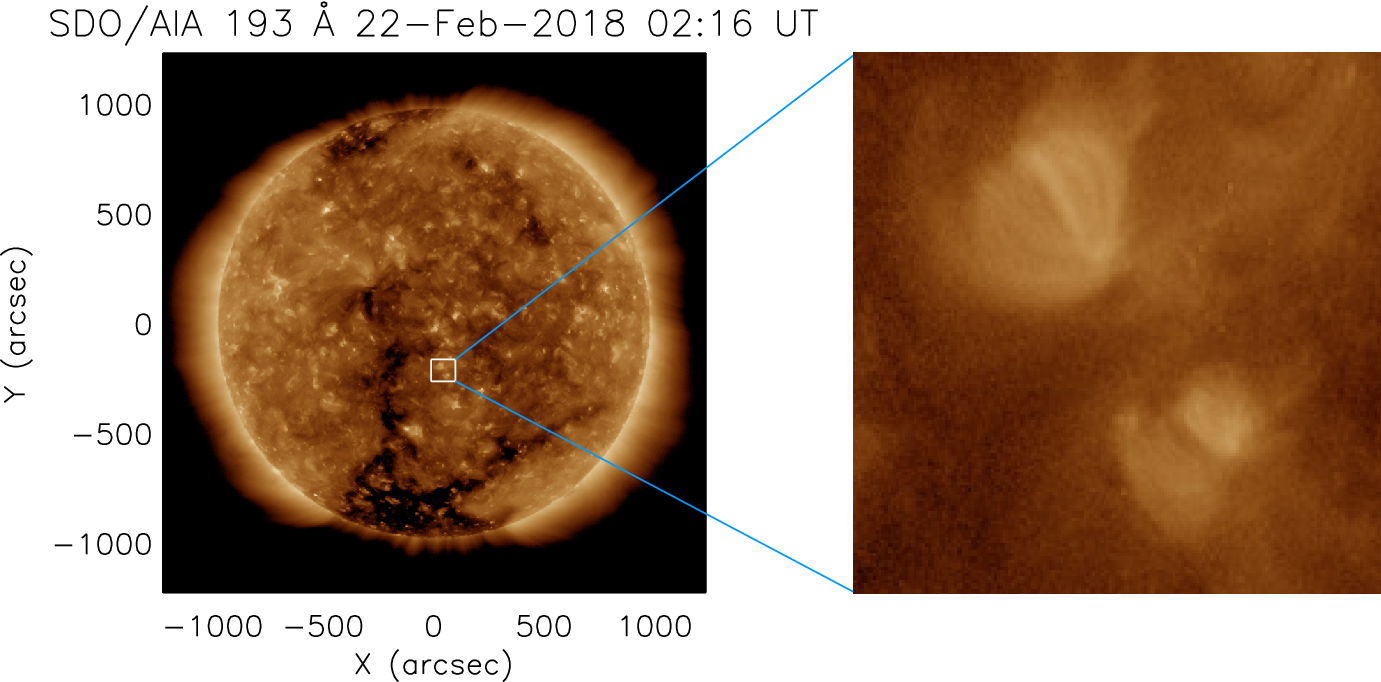
Left: full disk SDO/AIA image in the Fe xii 193 Å channel during the minimum of solar cycle 24 entirely dominated by the quiet Sun and coronal holes. A white square outlines a field-of-view that contains two bright points. Right: enlarged field-of-view of the outlined region in the left panel image (size of 110′′×100′′110′′×100′′)
Coronal Bright Points (CBPs) are small-scale structures with enhanced emission in the extreme-ultraviolet and X-ray spectrum that are detected in the low corona (Madjarska et al., 2019). These structures cover a wide range of temperatures, for they are usually made of hot loops (log (T[K])~6.2) overlying cooler ones (log(T[K])~6) with cool legs (log(T[K])~4.9) (Kwon, 2012).
According to the latest statistical survey of CBPs (Alipour et al., 2015), in April 2014 (when the special campaign from Deforest et al. (2018) took place), the average daily number of CBPs observed on the visible disk of the Sun was around 550. If one extrapolates this number to the full photosphere, covering 41253 deg2 in total, we can infer that, in April 2014, at first order there was 0.02 CBP per deg2 for 24h. This number encouraged us to investigate how CBPs can explain part of the high variability of the outer Solar Corona as described by Deforest et al. (2018).
Several physical processes could lead to the propagation of density variations in the low solar corona. One of them would be due to acoustic waves propagating from magnetic field fluctuations resulting from Alfvénic modes by adding a local transient heating which propagates a compressive wave along a magnetic flux tube (Hollweg, 1971). Another one would be magnetic reconnection processes between closed and open magnetic field lines, for closed field lines are known to contain denser plasma that the one usually propagating along open field lines.
The reconnection process could lead to the release of denser plasma along the open flux tube. Reconnection processes are also sources of extremely high temperature as the magnetic energy dissipates into heating. This additional heating due to reconnection processes can affect the plasma on the reconnected open field lines. If one ignores the addition of plasma and just focus on the additional heating, one can study how a sound wave propagating along the magnetic flux tube can actually lead to the propagation of a density fluctuation.
This hypothesis has been first explored in numerical simulations with a simplified model of solar wind propagation by Grappin (1999) to explain the origins of the fast solar wind, and further tested by the 16-moment code from Lie-Svendsen (2002) for different flux tube geometries corresponding to fast and slow solar winds. Regarding the statistical studies completed on Coronal Bright Points since then (Alipour et al., 2015) and the recent study from Deforest et al. (2018), we investigated this physical process in more details. We assume that part of the intense heating measured during CBPs occurs at the coronal base of open magnetic fields that channel the forming solar wind. We employ the solar wind model MULTI-VP to quantify the plasma compression induced by transient heating and investigate how the induced perturbation propagates to the upper corona.
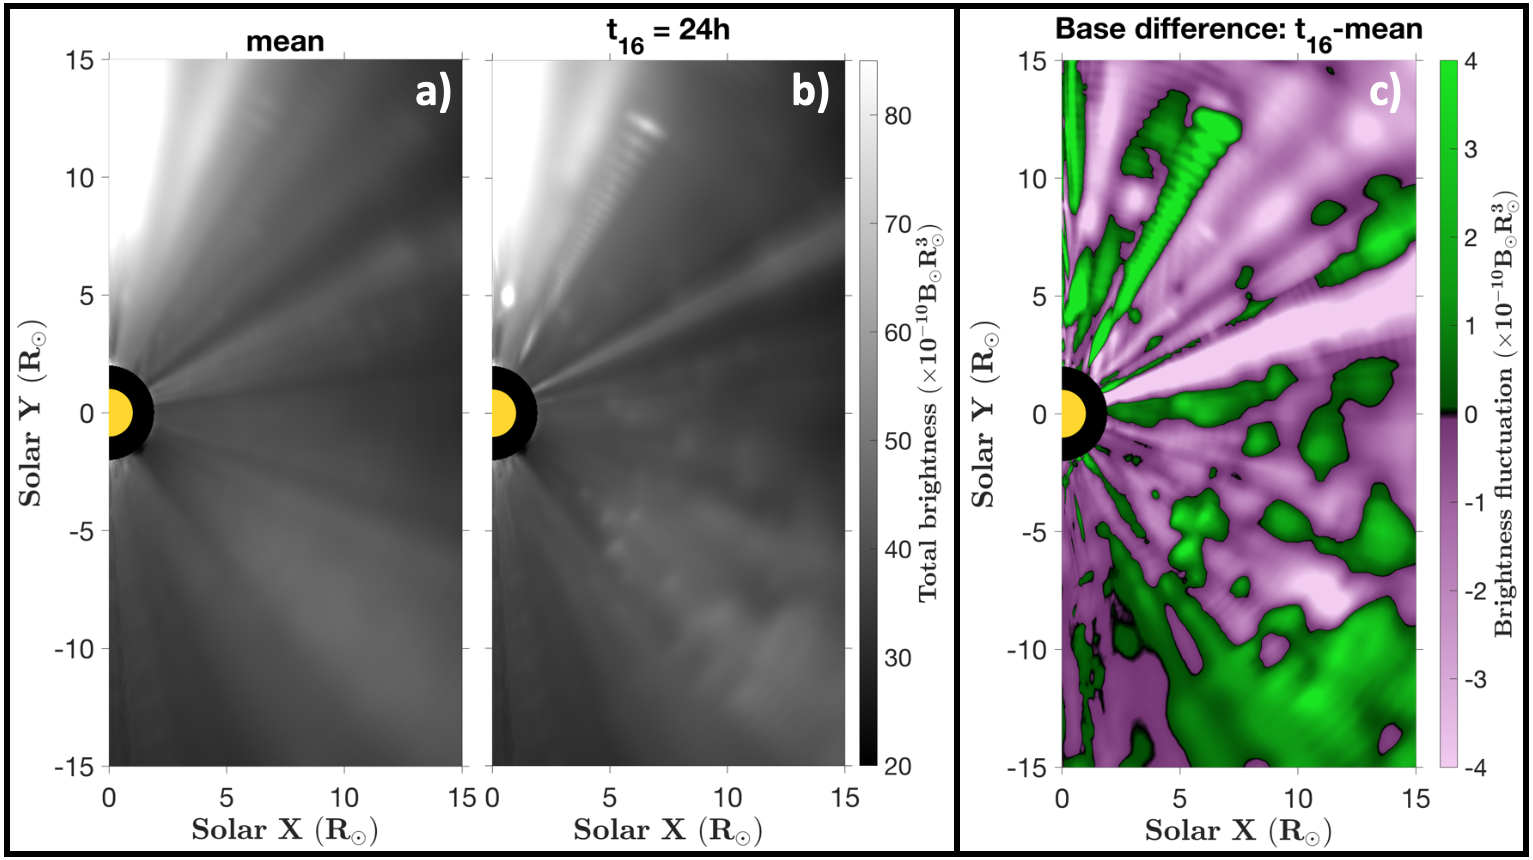
We show that for heating rates with statistics comparable to those observed during CBPs, the compressive wave initially increases the local plasma density by a factor of up to 50% at 5 solar radii. The wave expands rapidly beyond 30 solar radii and the local enhancement in density decreases beyond. Based on the occurrence rates of CBPs measured in previous studies, we impose transient heating events at the base of thousands of open magnetic field lines to study the response of the entire 3D corona.
The simulated density cubes are then converted into synthetic white-light imagery see Figure above). We show that the resulting brightness variations occupy all position angles in the images on timescales of hours. We conclude that a significant part of the ubiquitous brightness variability of the solar corona could originate in the strong transient heating of flux tubes induced by CBPs.